mathexpert published posts

Sample assignment on R statistics help

Answer all questions. Marks are indicated beside each question. You should submit your solutions before the
You should submit both
• a .pdf file containing written answers (word processed, or hand-written and scanned), and
• an .R file containing R code.
For all answers include
• the code you have written to determine the answer, the relevant output from this code, and a justification of how you got your answer.
• Total marks: 60 1. Consider the one parameter family of probability density functions

fb     for − b ≤ x ≤ b

where b > 0.
(a) Write R code to plot this pdf for various values of b > 0. [2 marks]
(b) Determine the method of moments estimator for the parameter b. (No R code necessary) [4 marks]
(c) Determine the Likelihood function for the parameter b. By writing R code to plot a suitable graph, determine that the derivative of this likelihood function is never zero. [4 marks] (d) Hence find the Maximum Likelihood Estimator for the parameter b. (No R code necessary) [4 marks] (e) The data in the file Question 1 data.csv contains 100 independent draws from the probability distribution with pdf fb(x), where the parameter b is unknown. Load the data into R using the command
D <- read . csv (path_to_f i l e )$x
where path_to_file indicates the path where you have saved the .csv file
e.g. path_to_file = “c:/My R Downloads/Question 1 data.csv”
Note that forward slashes are used to indicate folders (this is not consistent with the usual syntax for Microsoft operating systems).
Write R code to calculate an appropriate Method of Moments Estimate and a Maximum Likelihood Estimate for the parameter b, given this data. [4 marks]

  1. The data in the file Question 2 data.csv is thought to be a realisation of Geometric Brownian Motion
    St = S0eσWt+µt
    where Wt is a Wiener process and σ,µ and S0 are unknown parameters. Load the data into R using the command
    S <- read . csv (path_to_f i l e )
    where path_to_file indicates the path where you have saved the .csv file.
    (a) Write R code to determine the parameter S0. [2 marks]
    (b) Write R code to determine if Geometric Brownian Motion is suitable to model this data.
    You may do this by
    • plotting an appropriate scatter plot/histogram, and/or • using an appropriate statistical test.
    [6 marks]
    (c) Write R code to determine an estimate for µ and σ2 using Maximum Likelihood Estimators.
    (You do not have to derive these estimators). [5 marks]
  2. The data in the file Question 3 data.csv is a matrix of transition probabilities of a Markov Chain. Load the data into R using the command
    P <- as . matrix ( read . csv (path_to_f i l e ))
    with an appropriate value for path_to_file.
    (a) Verify that this Markov Chain is ergodic. (No R code necessary) [4 marks]
    (b) Suppose that an initial state vector is given by
    x=(0.1,0.2,0.4,0.1,0.2) (1)
    Write R code to determine the state vector after 10 time steps. Do this without diagonalising the matrix
    P. [3 marks]
    (c) Write R code to verify this answer by diagonalising the matrix P. Note that the eigen(A) function produces the right-eigenvectors of a matrix A (solutions of Av = λv) However we want the left-eigenvectors (solutions of vA= λv).
    These are related by
    v is a left-eigenvector of A if and only if vT is a right-eigenvector of AT.
    [8 marks]
    (d) Hence, or otherwise, determine the limiting distribution with the initial state vector given in (1).
    [4 marks]
  3. The data if the file Question 4 data.csv is a generator matrix for a Markov Process. Load the data into R using the command
    A <- as . matrix ( read . csv (path_to_f i l e ))
    with an appropriate value for path_to_file.
    (a) Suppose that X0 =0. Write R code to simulate one realisation of the Markov Process Xt. The output should be two vectors (or one data frame with two variables).
    • The first vector indicates transition times.
    • The second vector indicates which state the Markov Process takes at this time (i.e. one of 0,1,2,3,4).
    How to proceed:
    • The first line of your code must read
    set . seed (4311)
    to ensure that this realisation is repeatable.
    • For each Xt you must determine
    – what the transition time s to the next state is,
    – what the probabilities to transfer to each state are, and hence randomly select a suitable value for Xt+s.
    [9 marks] (b) Write R code to plot an appropriate graph that describes this realisation. [1 mark]
Submission
In your submitted report, you should address the research questions (shaded yellow below) by
reporting the analyses you are required to carry out (in italics below). To present your analyses and
conclusions you should write a detailed results section and a concise discussion section, using the
same format that would be expected in a journal article (i.e., APA style). There is a 1500-word
limit for this assignment. Independent of the word limit, you may include a maximum of five
tables and/or figures. References are not required but can be included to justify specific analytic
decisions (these will not be included in the word count).
Data  set
These data come from a study of healthy adults that included both questionnaires and cognitive
tasks. The accompanying text file is structured as follows:
Column 1 = participant ID number
Column 2 = delusional ideation (questionnaire range: 1-30; higher scores reflect greater lifetime
delusional ideation)
Column 3 = hallucination history (questionnaire range: 1-30; higher scores reflect greater lifetime
history of hallucinatory experiences)
Column 4 = pathology severity (questionnaire range: 10-100; higher scores reflect greater
psychopathology)
Column 5 = metacognition 1: perception (%; lower scores reflect poorer ability to think about one’s
perceptual states)
Column 6 = metacognition 2: memory (%; lower scores reflect poorer ability to think about one’s
memory)
Column 7 = source monitoring 1: speak vs. hear (%; higher values reflect poorer source
monitoring)
Column 8 = source monitoring 2: imagine vs. hear (%; higher values reflect poorer source
monitoring)
Input the data into SPSS to perform the subsequent analyses.
Research  questions
A team of researchers asked 180 healthy adults to complete the aforementioned set of questionnaires and cognitive tasks. The researchers were primarily interested in the cognitive variables that relate to the tendency to experience delusions and hallucinations. In addition to these two outcome measures, the other variables included a self-report scale of general psychopathology and measures of metacognition and source monitoring. In the metacognition tasks, participants had to complete a standard visual episodic memory or perception task and estimate their own performance.

The researchers sought to relate participants’ performance and their estimates of performance and thus created an outcome measure reflecting the percentage (%) correspondence between the two (higher % reflects greater correspondence or metacognition). The final two tasks measured source monitoring. In these tasks, participants had to perform one of two activities when presented with a word on a computer monitor (task 1: speak the word or listen to someone else speaking it; task 2: imagine the word being spoken or listen to someone else speaking it).

Afterwards, they were presented with a list of words and had to judge whether the word had been
spoken or heard (task 1) or imagined or heard (task 2). The researchers computed the percentage of
errors in these two tasks. All the individual data have been screened and cleaned so that there are
no missing data or miscodings; all data are normally distributed with no univariate or multivariate
outliers.

The researchers’ first question was whether they could predict delusional ideation and hallucination
history from the two measures of metacognition, two measures of source monitoring, and the single
measure of pathology severity. Carry out an analysis, or series of analyses, which will allow the
researchers to determine the answer to their first question. Briefly address whether the sample size
is suitable for this analysis (these analyses) and whether the data meet other assumptions of this
analysis (these analyses).

The researchers’ second question was motivated by the primacy of certain variables. In particular,
the authors thought that metacognition pertaining to perceptual states was more fundamental to
experiencing hallucinations than metacognition pertaining to memory. They similarly thought that
source monitoring pertaining to imagined vs. heard stimuli was more fundamental to experiencing
hallucinations than source monitoring pertaining to spoken vs. heard stimuli. Carry out an analysis,
or series of analyses, that would allow the researchers to incorporate their beliefs about the tasks
and allow them to understand the variables that predict hallucination experience.

The researchers’ third question concerned how source monitoring and metacognition relate to one
another in the prediction of hallucination experience. In particular, the researchers theorized that
metacognition for perception may underlie the relationship between source monitoring (imagined
vs. real) and hallucination history and thus that once you control for metacognition, the latter
relationship would reduce or disappear. Carry out an analysis, or series of analyses, which will
allow the researchers to determine the answer to this question.

If you need help with this assignment, then do not hesitate to contact us. Our writing experts can provide you with sample solutions for this assignment so that you can compare them with what you are working on.

ORDER THIS ASSIGNMENT

Please determine the best analytical method for each of the 8 questions below and conduct the appropriate analysis. Write up the analysis for each and submit on Canvas

Inferential statistics questions

Qn1. A school psychologist would like to test the effectiveness of a behavior-modification technique in controlling classroom outbursts. Every time a child has an outburst, then ten minutes of free time is taken away. Four children were followed for six months and numbers of outbursts were recorded before treatment and then six months after treatment. The psychologist wants to see if there is a decline in outbursts over time. Test the null hypothesis that there is no difference in outbursts. Use a .05 alpha level.

  1. An education statistics professor wants to see if her class has a similar average GRE quantitative score as the national average of 500. The class members have the following scores. Use an alpha level of .05.
    Class GRE Quant Scores
    450.00
    550.00
    525.00
    500.00
    425.00
    400.00
    515.00
    520.00
    500.00
    480.00
    490.00
    510.00
    650.00
    600.00
    400.00
    425.00
    620.00
    500.00

Hypotheses
H0: µ = 500
Ha: µ ≠ 500

  1. A soccer coach conducts a keeper clinic over the summer. She uses two different techniques to train – one for morning session children (n=13) and one for afternoon session children (n=13). She records the number of saves made by keepers at an end-of-summer drill. She wants to see if there was a difference in number of saves by keepers in the morning sessions and afternoon sessions, thereby indicating that one method would be better than the other. Use a .05 alpha level.

Qn4. A professor gives a standardized achievement test to students after going through a course in sociology. She wants to see if her students scored similarly to the national average of sociology students on the test. The population of first year sociology students has an average score of 170 on the test. Use an alpha level of .05 and determine if there is a difference between her students’ scores and the population mean.

Qn5. An English teacher wants to see if composition scores for three classes in her school are similar or different. She suspects that there are teacher differences in how composition is taught. At the end of the semester she collects scores from a standard composition test from students in each class. She has a teacher from another school score the tests, and then she takes a random sample of the scores. The scores for each class are listed below. Test the null hypothesis that there is no difference in scores. Use an alpha level of .05.

Qn6. A study on the reaction time of children with cerebral palsy reports a mean of 1.6 seconds on a particular task. A research believes that the reaction time can be reduced by using a motivating set of directions. Twelve children were given the motivating set of directions and their reaction times are recorded. A separate sample of twelve children was given no motivating directions, and completed the same task. Test if there is a difference between tes sample with motivating directions and the one without motivating directions. Use an alpha of .05.

Qn7. A method to improve math achievement was tested by an elementary school teacher. Students were given a math pretest then given the particular math tutoring. After tutoring, a post test was given. Test if there is a difference between pre and post math scores. Use alpha of .05.

Qn8. An educational psychologist designs a research study to investigate different problem-solving strategies. Subjects are randomly assigned to one of five different groups. Each group is taught to use a different problem-solving strategy. After the training, each subject is given a series of problems to solve using the various strategies. The data below are times each subject spent solving the problems. Test the hypothesis that there is no difference among groups in terms of time spend solving a problem. Use and alpha of .05.

Statistics homework help

The file containing the data for each question is attached here for your reference, and if you'd like help with this assignment, then do not cease to contact us. Note that we also have solutions for this assignment ready,statistics homework 3.docx which you can purchase to compare with your analysis.

order statistics homework

Hypothesis testing questions.
Question 1
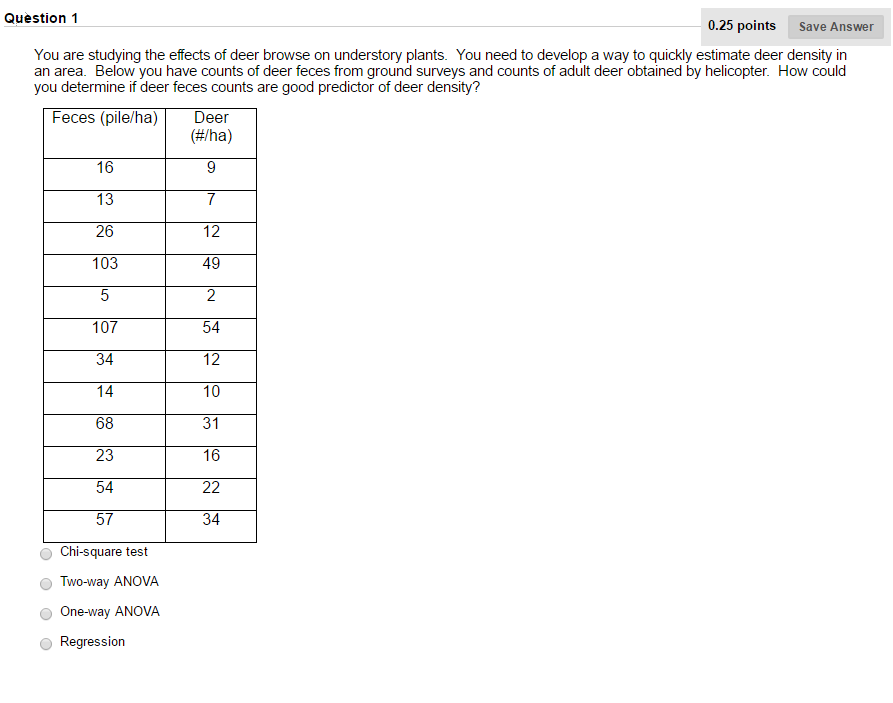
You are studying the effects of deer browse on understory plants. You need to develop a way to quickly estimate deer density in an area. Below you have counts of deer feces from ground surveys and counts of adult deer obtained by helicopter. How could you determine if deer feces are a good predictor of deer density?
deer.png
anova.png

question 3.png

Assessment Item 2 Research Report
BSB123 Data Analysis

Assessment Item 2 Research Report (2017 S1)

Data
The file: Birthweights.xlsx contains data on the following variables for a sample of 1000 births recorded in a large local hospital in 2015:

Variable Description
Birthweight Birthweight in grams
Gestation Length of pregnancy in days
Smoke Whether the mother is a smoker or not
Pre-pregnancy weight Mother’s pre-pregnancy weight in kilograms
Height Mothers height in centimetres
Status Mother’s indigenous status
Age Mother’s age in years

Background
Management at the hospital is interested in being able to better manage room allocations and bookings in their maternity ward. They are keen to identify mothers at risk of having low birth weight babies who may require additional hospital resources during their stay in the hospital.

The hospital has collected data for a number of previous births at the hospital. The data contains information on the variables outlined in the table above. As a consultant, they have approached you and asked if you could analyse this dataset.

Tasks
Part 1 - Analysis (80%)

  1. Past records (2004) show that the average birthweight was 3500 grams. Test at 5% if the average birthweight in 2015 has increased with the improvement in general nutrition.
    (Include all six steps for hypothesis testing.)

                               (2 marks)
  2. Perform a two-sample t-test for each of the following tasks. (Include all six steps for hypothesis testing in each.)
    (a) Determine if there is evidence that on average the weight of a baby of a mother who smokes is less than that of a mother who does not. ( = 5%)

                              (2 marks)

    (b) Determine if being indigenous is a disadvantage in terms of birthweight. ( = 5%)
    (2 marks)
    The hospital management is particularly interested in whether you can develop a regression model to help them to predict the birthweight of a baby based on the variables in the data supplied. The model could then be used to predict birthweight to identify babies at risk in future.

  3. By using the forward stepwise method, develop a multiple regression model to predict the birthweight.
    Step 1: Gestation only
    Step 2: Gestation and Smoke
    Step 3: Gestation, Smoke and Pre-pregnancy Weight
    Step 4: Gestation, Smoke, Pre-pregnancy Weight and Height
    Step 5: Gestation, Smoke, Pre-pregnancy Weight, Height and Status
    Step 6: Gestation, Smoke, Pre-pregnancy Weight, Height, Status and Age
    (a) Interpret the regression coefficients of all six (6) independent variables in the model obtained in Step 6, and comment on the statistical significance of each.
    (3 marks)
    (b) Use Excel to obtain the correlation matrix for the following variables: Gestation, Pre-pregnancy Weight, Height, Age and Birthweight. Do you think multi-collinearity is a problem in the regression model? Are the correlation coefficients consistent with the regression coefficients obtained in the model in Step 6? Discuss briefly.
    (3 marks)
    (c) Focusing on Steps 3 and 4, discuss fully how the introduction of Height in Step 4 affects the regression coefficient of Pre-pregnancy Weight.
    (3 marks)
    (d) Based on the results in (a) to (c), explain which independent variables should be included or excluded to formulate the final model. State the final model.
    (2 marks)
    (e) Comment on the overall adequacy of the final model.
    (2 marks)
    (f) Consider an indigenous mother who is a smoker, 20 years of age, and 160cm tall with a pre-pregnancy weight of 58kg and gestational age of 267 days. What is the expected weight of the child, using the final model you have developed in (d)?
    (2 marks)
  4. Compute the difference in the average birthweight of babies of indigenous and non-indigenous mothers (called the birthweight difference, for simplicity). Discuss fully if there is any discrepancy between the regression coefficient of Status obtained in the regression model and the birthweight difference.
    (3 marks)

    Part 2 – Report (20%)
    You are required to submit a concise report (word limit: 400) presenting any important features or relationships in the data. The content of your report should be based on, but not restricted to, insights gleaned from your analyses conducted in Part 1.
    (6 marks)

Notes:
Part 1 - Analysis
• For presentation and ease of marking, it is advisable to include relevant Excel output in your answer to each question in this part instead of placing them in appendices.
• There is no word limit in Part 1.
Part 2 - Report
• The report is primarily based on the data provided. If, however, you wish to include, and refer to, additional information, you can use any referencing system as long as it is used consistently.
• You can include relevant charts and Excel objects in your report.
• Use 1 & ½ spacing and font size of 11.
• The word limit of 400 (with a tolerance of 10%) is exclusive of words in tables, appendices and reference list (if any).

Submission
• You should submit your response to both parts as a single pdf document saved in the format:
BSB123 Report_StudentName.pdf
• After uploading your research report, it is your responsibility to go back to the Assignment Upload page to check that your report was properly uploaded.
• Due: 11:59 pm 28 May 2017 (Sunday) via Blackboard