Posts under category statistics homework help

Qn18 Find the indicated probability using the standard normal distribution
P(-1.16 < z < 1.16)
Qn19. Assume the random variable x is normally distributed with mean mu = 50 and standard deviation sigma = 7. Find the indicated probability.
P(x > 43)
Qn20. Use the normal distribution of SAT critical reading scores for which the mean is 514 and the standard deviation is 121. Assume the variable x is normally distribted.
a. What percentage of the SAT verbal scores are less than 550?
b. If 1000 SAT verbal scores are randomly selected, about how many would you expect to be greater than 525?
Using normal and Binomial distribution tables

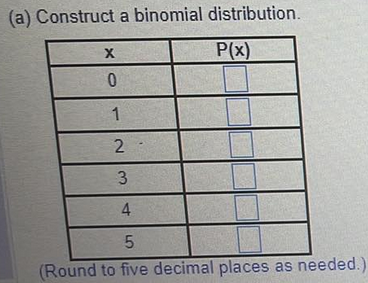
Qn14. Seventy-six percent of adults want to live to age 100. You randomly select five adults and ask them whether they want to live to age 100. The random variable represents the number of adults who want to live to age 100. Complete parts (a) through (c) below.
probability distribution table.png

Graph the binomial distribution using a histogram and describe its shape.

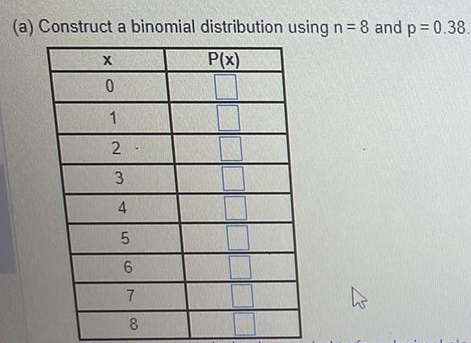
Qn15. 38% of employees judge their peers by the cleanliness of their workspaces. You randomly select 8 employees and ask them whether they judge their peers by the cleanliness of their workspaces. The random variable represents the number of employees who judge their peers by the cleanliness of their workspaces. Complete parts a through c below.

binomial table.png

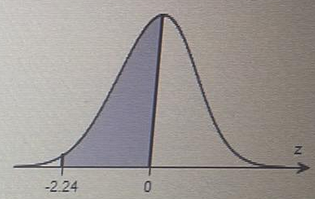
Qn16. Find the area of the shaded region under the normal curve. If convenient, use technology to find the area.
standard normal distribution table.png

Qn17. A standardized exam’s scores are normally distributed. In a recent year, the mean test score was 20.8 and the standard deviation was 5.6. The test scores of four students selected at random are 13,23,9, and 36. Find the z-scores that correspond to each value and determine whether any of the values are unusual.

Qn11. Determine whether the random variable X is discrete or continuous. Explain.
Let x represent the amount of rain in City B during April.
random variable table.png
Qn12. Find the mean variance, and standard deviation of the binomial distribution with the given values of n and p.
Qn13. Complete parts (a) and (b) below.
The number of dogs per household in a small town
number of dogs per household.png
Find the mean, variance, and standard deviation of the probability distribution.

DS 123 Statistical Analysis

Assignment 4 instructions

This Assignment consists of two parts: Part 1 includes questions from textbook, and Part 2 is application using JMP. In total, you will be creating 2-3 files for this assignment. For Part 1 you will create either Word file or Excel file (see details below). For Part 2, you will have 1 JMP report files. Hence, you need to submit your all the files in a single attempt. You may submit multiple attempts if you make corrections. But, note that each attempt should contain all files. (Total 20pts)

Part 1. (20pts)

  1. Work on the following problems from the textbook. Clearly indicate how you arrived to solution. You need to show your work to earn credit.
  2. You may solve questions by calculator (not using Excel). Then, use Word document to write down answers. Label question numbers clearly and do not forget to write down your name and section number.
    o You may submit handwritten paper, but make sure it is eligible to read and all the problems should be in a single document (do not submit separate files for each question)
  3. You may also solve questions using Excel/JMP. In this case, submit your Excel file or copy/paste output of JMP file in Word document. Again, make sure to label question numbers and answers clearly. You may use similar template provided in previous assignment.

Question sets:
11.2, 11.4, 11.6
11.16
11.22

Part 2. (5pts- Extra Credit)
• Use JMP to Conduct ANOVA. Follow instructions indicated in document files named “Using JMP to Conduct Analysis of Variance” (or click here

STAT 170 – Elementary Statistics Quantitative Reasoning Project
Use the following steps to test hypotheses about your statistics project.

When the problem involves hypothesis testing, use the following structure for written reports.
• Step 1: State the hypotheses.
• Step 2: Summarize the data for your readers.
• Step 3: Give the value of the test statistic and the p-value.
• Step 4: Use the p-value to draw a conclusion. State the conclusion in statistical
terms: Reject Ho in favor of Ha, or retain Ho (fail to reject Ho).
• Step 5: State the conclusion in layman terms and in context of the application. Use the
p-value to state the strength of the evidence.
• p-value > .10
retain Ho – there is insufficient evidence to reject Ho in favor of Ha
• .05 < p-value ≤ .10
gray area -- decision to reject Ho or retain Ho is up to the investigators – there is some
evidence against Ho and in support of Ha
• .01 < p-value ≤ .05
reject Ho in favor of Ha – there is fairly strong evidence against Ho and in favor of Ha
• .001 < p-value ≤ .01
reject Ho in favor of Ha – there is strong evidence against Ho and in favor of Ha
• p-value ≤ .001
reject Ho in favor of Ha – there is very strong evidence against Ho and in favor of Ha

Use your TI-83/TI-84 calculator for all of these problems. You will not need any tables.
Use the Sample Test 3 Questions—Answer Key (posted in Canvas) as an example of what my
expectations are.