            Homework Assignment #3
            First assignment on Semester Project
As the first step in your Regression Project, find a data set that is of interest to you. The data set should contain at least 50 rows of data and have a y-variable and an x-variable for now, and at least 4 x-variables as regressors later on (to make the "model selection" sections interesting). Some possible sources of data sets are given in the posted guide.
However, if you do not readily find a data set, do not waste all weekend trying to find the "perfect" data set. Rather, just grab some baseball data (but not mine) or some quarterly Bureau of Labor Statistics data and use that for this assignment. Then, if you decide to use something different for your project, you will find it is fairly easy to redo this assignment for inclusion in your project, because you will have already have done the assignment once.
For the SAS and R questions, you are free to insert your data (and change the variable names) of the SAS and R templates given in the lecture notes.
Imbed all graphs and tables in the document. Do NOT put them on separate pages, as the reader will soon give up looking for them.
This homework, and all the following homework, will be drafts of chapters of your semester project. Therefore, with that goal in mind, please structure as follows:
(1) show the given chapter headings, such as
Chapter 1
(b) show the given underlined section headers, such as
- Scatterplots,
(c) do NOT show the questions asked: just answer them! That means, that the answer has to include the question. Example: “Why are you going home?” A good answer: “I am going home to feed the dog.” A weak answer: “To feed the dog.”
Show Title: A Multiple Regression Analysis of
Show your Name: _
Chapter 1
1. Topic
The subject of this study is to investigate the relationship between sale price of houses and its lost size. The purpose is to inform my future house purchasing decision, to effectively predict the probable cost of a house given its characteristics. The goal is to effectively purchase a house having determined the range within which its true price is likely to fall.
- Data Source
The dataset is obtained from Rdata sets directory available at Github.io.
https://vincentarelbundock.github.io/Rdatasets/datasets.html
https://raw.githubusercontent.com/vincentarelbundock/Rdatasets/master/csv/Ecdat/Housing.csv
- Variables
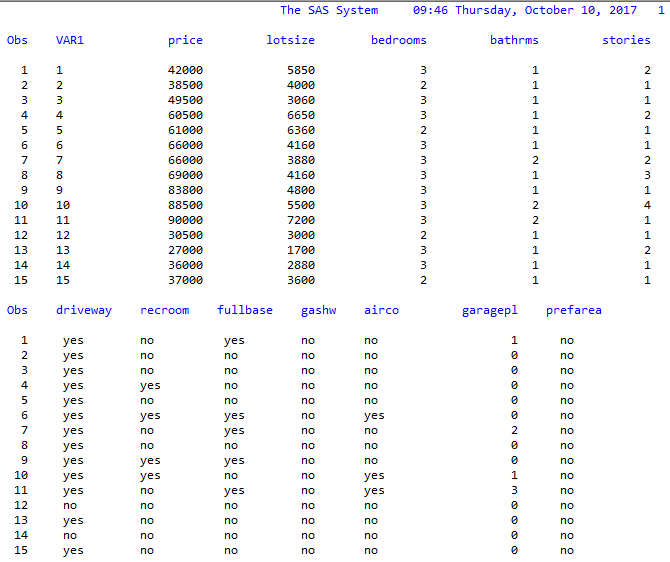
The data set has 546 observations (n = 546) and 13 variables. The variables in this dataset are:
Price (sale price of a house)
Lotsize (the lot size of a property in square feet)
Bedrooms (number of bedrooms)
Bathrms (number of full bathrooms)
Stories (number of stories excluding basement)
Driveway (does the house has a driveway ?)
Recroom (does the house has a recreational room ?)
Fullbase (does the house has a full finished basement ?)
Gashw (does the house uses gas for hot water heating ?)
Airco (does the house has central air conditioning ?)
Garagepl (number of garage places)
Prefarea (is the house located in the preferred neighbourhood of the city ?)
- Data View

The first 15 observations are displayed above.
Chapter 2 A Simple Regression Model
  Predicting house price using its lot size. x=lot size, y=price.
SAS output
- Scatterplots

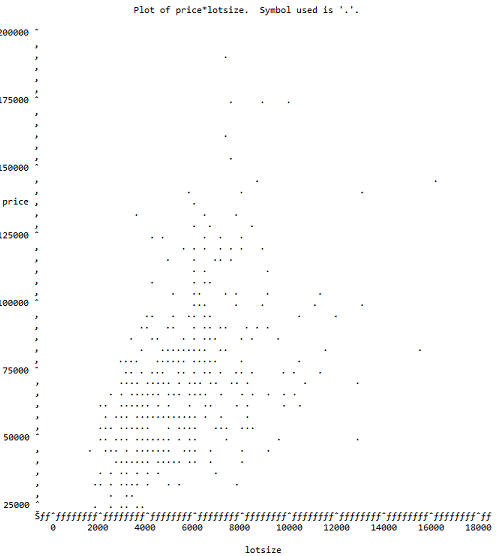
Scatterplot of price vs. lot size.
- Analysis of Scatterplot
- The Linear Regression Model
State your regression model and briefly explain
The regression model is:
(a) the meaning of your YX term in the model;
(b) how the terms on the right-side are related to E(YX);
(c) how the terms on the right-side are related to V(YX).
- SAS Output for the Fitted Model

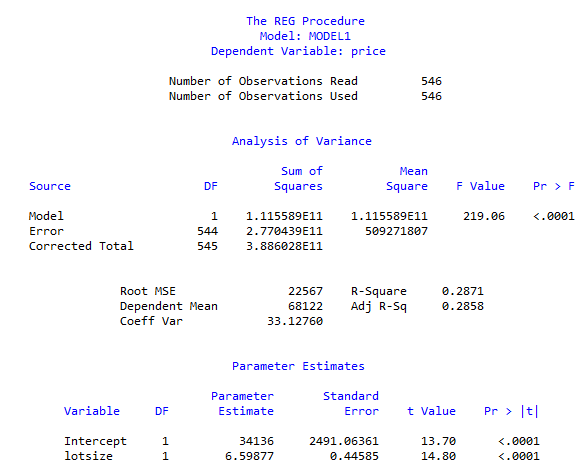
Run Proc Reg in SAS to fit your model. Show the table output, cleaned-up, and the SAS regression plot with the confidence and prediction bands. Otherwise, only show what you are going to use.
- Analysis of Output
(a) The t-tests
(i) What is being tested?
(ii) What are the results of the test?
(iii) Use the Story of Many Possible Sample to explain how the test is done.
(b) The -equation
    (i) State the equation for your fitted model;
 (ii) Explain howis related to E(YX) using the story of many possible samples.
(c) In the regression plot, explain what is being shown by the 95% confidence band and the 95% prediction band. Include a vertical x-cut to provide a focus for your explanation.


