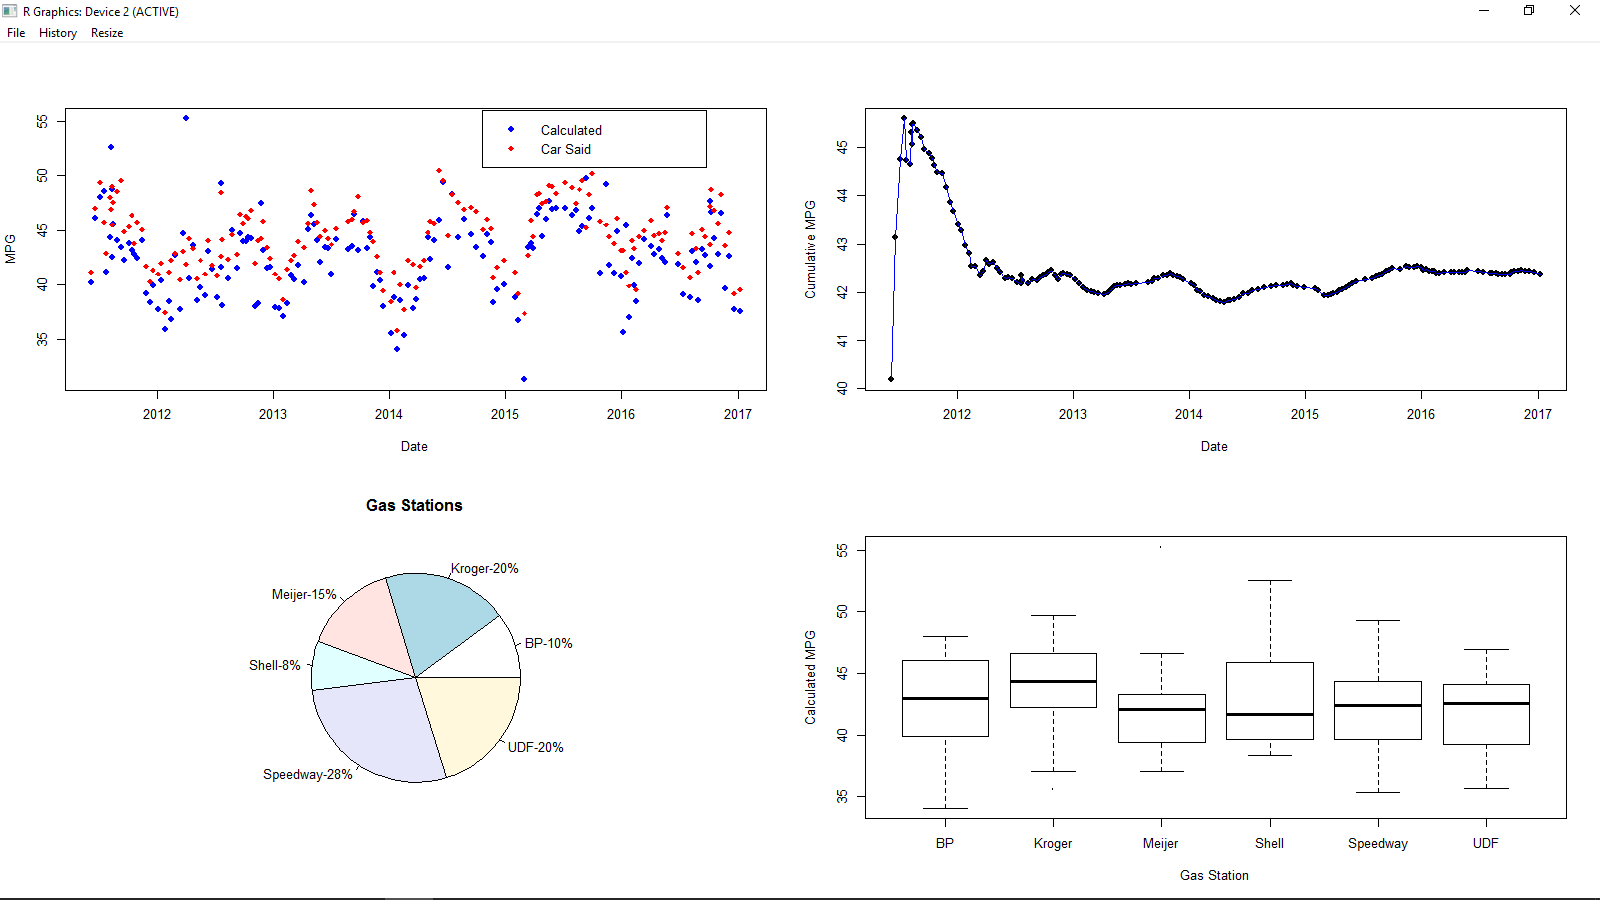
write an R script that will produce a SEPARATE WINDOW with this output
Working With R Files
Save your work to a .r file. Name yor file like
Upload your files to DropBox.
I have provided you with a .csv file called Insight.csv. It contains the log of my Honda Insight’s mileage since I bought it. There is a header row at the top of the spreadsheet. The columns are mostly self-explanatory, but just in case:
Date: the date of the fill up
Miles: the number of miles on the odometer when I filled up
Gallons: the number of gallons I put in the car
Price.per.Gallon: the price per gallon of gas
Total.cost: the total cost of the fillup (i.e., Price.Per.Gallon * Gallons)
Grade: the grade of gasoline purchased
MPG: the calculated miles per gallon for that tank (Miles/Gallons)
Price.Per.Mile: Total.cost/Miles
Cumulative.Miles: cumulative miles driven by the car
Cumulative.Gallons: cumulative gallons of gas purchased
Cumulative.Cost: cumulative cost of gas purchased
Cumulative.MPG: Cumulatove.Miles/Cumulative.Gallons
Cumulative.Price.per.Mile: Cumulative.Cost/Cumulative.Miles
Gas.Source: the chain of gas station the gas came from
Car.Said: the mileage for that tank that the car’s on-board computer reported
Delta: the difference between the mileage the car said and the mileage I calculated
Average.Price.of.Gas: cumulative average price paid per gallon of gas
Avg.Temp: average temperature for the period since the last fill-up, taken from a website at UD
Given this data, write an R script that will produce a SEPARATE WINDOW with this output.

Note that the bottom right chart may not display all the labels on the X-axis until the window is maximized….that’s okay.
IMPORTANT NOTE: There are several gas stations that only have one or a small number of entries. Those should be INCLUDED in the data for the first two charts, but EXCLUDED when producing the bottom two charts. The following code will quickly accomplish this for you:
Assuming you have read the data into a dataframe called mileage:
tbl <- table(mileage$Gas.Source)
new.Mileage <- droplevels(mileage[mileage$Gas.Source %in% names(tbl)[tbl>10],,drop=FALSE])
The dataframe new.Mileage now has the data minus any entries where there were fewer than 10 observations at that Gas.Source.
Your script should begin with reading in the data. You can assume that your script and the data file are both in the working directory, so you need to only reference the filename (Insight.csv) and not worry about the file path.